
Industrial AI in Manufacturing: Why Static Data Beats Sensor‑Only
Context is King:
Why Static Plant Data is the Indispensable Foundation for Accurate Industrial AI
Part I: The Incomplete Narrative of Time-Series Data
The advent of Industry 4.0 has been largely defined by an explosion in data generation, particularly real-time, time-series data from industrial processes. This deluge of information, captured from sensors embedded throughout manufacturing facilities, has become the primary fuel for a new generation of Artificial Intelligence (AI) and Machine Learning (ML) applications aimed at revolutionizing industrial operations. These data streams offer an unprecedented, high-frequency view into the dynamic behavior of a plant, enabling a host of optimizations that were previously unattainable. However, a critical examination reveals that this sensor-only perspective, while powerful, tells an incomplete and often misleading story. Relying solely on time-series data for analysis and decision-making introduces fundamental limitations that cap the potential of industrial AI and, in many cases, lead to erroneous conclusions and failed projects. This section will explore the anatomy of these data streams, the conventional AI applications they power, and the intrinsic limitations that arise from their lack of physical and operational context.
The Anatomy of Process Data Streams
Industrial time-series data is the digital pulse of a manufacturing facility. It consists of sequential data points indexed by timestamps, generated at immense volume and velocity by a network of sensors, machines, and Industrial Internet of Things (IIoT) devices. These data streams capture the dynamic state of the plant’s core operations, measuring critical process variables such as temperature, pressure, flow rates, vibration levels, energy consumption, and ambient conditions like humidity. The interconnection of factory systems has enabled the efficient capture, management, and transmission of this data, making it the backbone of modern operational technology (OT) and data-driven decision-making.
The primary function of this data is to facilitate real-time monitoring. Specialized time-series databases, such as IndustryOS®, are optimized to handle these high-volume, high-frequency data streams, allowing engineers to query and visualize the performance of specific operations on a second-by-second or even millisecond-by-millisecond basis. This capability is invaluable for tracking equipment health, identifying operational inefficiencies, and maintaining process stability. The data itself can be structured, such as numerical readings from a pressure sensor, or unstructured, like images from quality control cameras or audio signals from machinery, demanding specialized tools and algorithms for parsing and analysis.
Conventional Artificial intelligence (AI) ⇲ Applications Fueled by Time-Series Data
The availability of vast historical and real-time datasets has spurred the development of numerous AI and ML applications designed to extract actionable insights directly from these time-series streams. These applications generally fall into three major categories, each promising significant improvements in efficiency, reliability, and quality.
Predictive maintenance is arguably the most prevalent and mature application of machine learning in the manufacturing sector today. The core principle is to move away from reactive (“fix-when-broke”) or scheduled maintenance toward a proactive, data-driven approach. IndustryOS® uses Specialized AI algorithms analyze streams of sensor data, such as temperature, vibration, and pressure, to identify patterns and anomalies that may indicate an impending equipment failure. By learning from historical data, these models can predict the probability of a failure occurring within a specified timeframe or estimate the Remaining Useful Life (RUL) of a component. This foresight allows maintenance to be scheduled proactively, minimizing unplanned downtime, reducing repair costs, and extending the overall lifespan of critical assets. Global manufacturers have reported millions of dollars in savings from such systems, which can monitor thousands of machines and provide maintenance warnings weeks in advance.
AI models are increasingly used to optimize complex manufacturing processes where numerous variables interact in non-linear ways. By analyzing real-time data from sensors and control systems, tailored ML models can identify potential inefficiencies and suggest adjustments to process parameters to enhance throughput, improve product yield, and minimize waste and energy consumption. For example, in a chemical plant, an AI model might analyze the operation of a distillation column and recommend fine-tuning the reflux ratio and feed temperature to improve product purity without increasing energy use. Similarly, models can optimize temperature profiles in furnaces or forehearths to ensure product consistency and reduce defects. This continuous, data-driven optimization allows plants to operate closer to their true potential, adapting to changing conditions in real-time in a way that is impossible for human operators to replicate.
Quality Control and Anomaly Detection (Quality Optimization⇲ )
In the realm of quality control, AI systems trained on historical time-series data can detect subtle, irregular patterns in process inputs or outputs that may signal a deviation from quality standards. This form of anomaly detection allows engineers to identify and address potential quality issues before they result in off-spec products or scrap. For instance, an AI system could monitor torque values during an assembly process to ensure bolts are tightened to specification, alerting operators if values go beyond acceptable ranges. These systems like IndustryOS® augment or automate manual inspection processes, which are often slow and prone to human error, by providing a consistent and highly accurate method for monitoring product quality in real-time.
The Intrinsic Limitations of a Sensor-Only View: The "Context Gap"
Despite the successes of these applications, a model that relies exclusively on time-series data operates with a profound and debilitating handicap: it lacks context. It sees the effects of the process but is blind to the underlying physical causes. This “context gap” manifests in several fundamental limitations that undermine the reliability and ultimate value of the insights generated. The widespread adoption of time-series AI in manufacturing can be seen as a direct transplantation of data science paradigms from the digital world—such as finance or e-commerce—to the industrial world, without a necessary re-evaluation of the problem’s core nature. In digital domains, historical patterns are often strong predictors of future behavior, as the underlying “rules” are largely statistical or linguistic. A manufacturing plant, however, is not governed by statistics alone; it is governed by the immutable laws of physics, chemistry, and thermodynamics. It is a physically constrained system. The high failure rate of industrial AI projects, which a 2024 RAND report places at over 80%, is attributed precisely to this issue, citing “process complexity” and a “lack of real-world context” as primary culprits. The failure is not in the algorithms themselves, but in the misapplication of a purely data-driven paradigm to a physics-first domain. The classic data science mantra of “garbage in, garbage out” is amplified, where “garbage” is not merely bad data, but critically incomplete data that is stripped of its physical meaning.
Violating Core Assumptions
Many classical time-series models, such as ARIMA (Autoregressive Integrated Moving Average), are built on strict statistical assumptions, most notably the assumption of stationarity—that the data’s statistical properties, like its mean and variance, remain constant over time. However, real-world industrial data frequently violates this assumption. Processes exhibit trends due to equipment degradation, seasonality due to ambient temperature changes, and abrupt shifts due to changes in feedstock or operational setpoints. Applying models that assume stationarity to non-stationary data can lead to fundamentally flawed forecasts and unreliable performance. While techniques exist to transform data to be more stationary, residual non-stationarity can persist, leading to models that capture noise instead of true patterns.

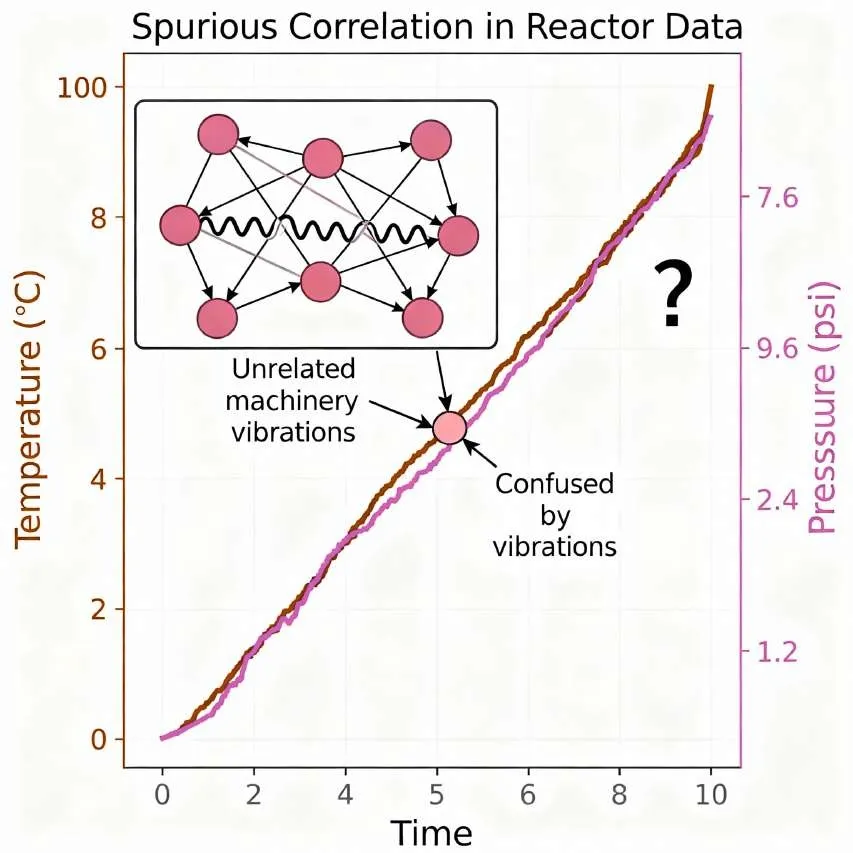
The Correlation vs. Causation Fallacy
Time-series analysis is exceptionally good at identifying correlations within and between data streams. A model can easily learn that a rise in a reactor’s temperature is correlated with a rise in its internal pressure. However, the model has no inherent ability to distinguish this correlation from causation. It does not understand the Ideal Gas Law () that governs this relationship. This becomes problematic when the model encounters spurious correlations—coincidences in the data that are not linked by any physical mechanism. For example, a model might notice that a particular pump’s vibration increases whenever a nearby, unrelated production line is active. Without physical context, it might incorrectly conclude that the production line’s activity causes the vibration, leading to nonsensical maintenance recommendations.
Inability to Explain the "Why"
Perhaps the most significant failure of a time-series-only model is its inability to provide causal explanations. The model can be expertly trained to flag that a value is anomalous—for instance, that the pressure in a pipeline is unexpectedly low. Yet, it is structurally incapable of explaining why. It lacks any knowledge of the physical system that generated the data. It cannot differentiate between a pipeline leak, a downstream blockage that has caused the pump to move to a different point on its curve, or a failing pump that is no longer generating sufficient head. As one analysis puts it, it is very difficult to draw a conclusion on a value when you don’t understand what it truly means. The model can only report the symptom; it cannot diagnose the disease.
Vulnerability to Model Drift
Research has shown that the performance of a staggering 91% of machine learning models degrades over time in production, a phenomenon known as “model drift” or “model decay”. This occurs when the statistical properties of the live data being fed into the model diverge from the data it was originally trained on. In a manufacturing environment, this is a constant reality. Equipment wears down, raw material quality varies, operators change procedures, and ambient conditions fluctuate. A time-series-only model, blind to the physical world, cannot comprehend the reason for this drift. It only sees that its predictions are becoming less accurate. Consequently, the only remedy is periodic retraining on new data, a reactive and often computationally expensive process that treats the symptom without understanding the underlying cause of the change.

The "Black Box" Problem
The entire SIRI transformation journey is guided by the LEAD framework, a four-step process that emphasizes the continuous and cyclical nature of digital transformation. This model positions the SA not as a one-time event but as a recurring milestone in an ongoing cycle of improvement. The four stages are:
Part II: The Ground Truth: Establishing the Static Data Universe
To bridge the context gap left by time-series data, AI models must be grounded in the plant’s “ground truth”—the vast repository of static data that defines the physical reality, design intent, and operational constraints of the facility. This static data universe provides the essential framework for interpreting dynamic sensor readings, transforming them from abstract numbers into meaningful indicators of physical phenomena. This section will define this class of data, categorize its most critical forms—from engineering blueprints to operational procedures—and establish its role as the codified expression of decades of human engineering expertise.

Defining Static Data in an Industrial Context
In any organization, static data represents information that remains unchanged or changes infrequently over long periods. It serves as a stable and reliable reference point for analysis and decision-making, providing a consistent foundation upon which dynamic operations can be understood. While in a business context this might include customer profiles or product details, in an industrial plant, static data encompasses the entire engineering and operational knowledge base that describes the facility’s physical and procedural landscape.

A primary challenge in leveraging this data is not its existence, but its accessibility and integrity. It is a concerning reality that for the majority of industrial assets, this crucial information is not readily available or up-to-date. According to the ARC Advisory Group, the average percentage of industrial assets with current, accurate information is less than 50%. This data is often trapped in disconnected, siloed systems—engineering drawings in one database, maintenance records in another, and operational procedures in a third—making it exceedingly difficult to aggregate and apply in a cohesive manner. When users discover that data is incomplete or inaccurate, they begin to doubt the validity of all available information, undermining the very foundation of a data-driven culture. IndustryOS® built by Sparrow exactly uses Static data very intelligently as a base for the data strucutre upon which the digital infrastructure is built.
The Plant's Blueprint: Piping & Instrumentation Diagrams (P&IDs)
The Piping and Instrumentation Diagram (P&ID) is the foundational document for any process plant. It is a comprehensive, two-dimensional schematic that serves as the blueprint for the process system’s design, illustrating the intricate functional relationships between all piping, instrumentation, and equipment components.
P&IDs encode a wealth of static information using a standardized set of symbols and notations, providing a universal language for engineers and operators. Key information contained within a P&ID includes:
- Equipment: Detailed representation and identification of all major process equipment, such as pumps, compressors, vessels, tanks, heat exchangers, reactors, and distillation columns.
- Piping: The complete piping network, showing interconnections between equipment, line numbers, pipe sizes, and crucially, the intended direction of fluid flow.
- Instrumentation and Control Systems: The precise location and identification of all instruments used to monitor and control the process. This includes sensors (e.g., pressure transmitters (PT), temperature transmitters (TT), flow transmitters (FT)), valves (including control valves, safety relief valves, and manual valves), and the control loops that connect them, each with a unique identifier for tracing its function.
Throughout the lifecycle of a plant, the P&ID serves as the single most critical reference document. It is used during the initial design and construction phase to lay out the plant, during day-to-day operations to understand process flow, and during maintenance and troubleshooting to locate and identify equipment. It is also indispensable for safety management, as it clearly marks the location of safety-critical devices.
The Physics of the Assets: Mechanical and Electrical Specifications
Beyond the topological layout provided by the P&ID, a deeper level of static data describes the physical characteristics and performance capabilities of each individual asset. This engineering data, often managed in specialized Asset Information Management (AIM) systems, contains the specific parameters needed for any physics-based analysis.
Mechanical Data
- Pump Performance Curves: A pump curve is a graphical representation, provided by the manufacturer, that defines a pump’s operational characteristics. It charts the relationship between the flow rate the pump produces and the pressure (expressed as “head”) it can generate against system resistance. The curve is specific to a pump’s model, speed (RPM), and impeller diameter. It also specifies the pump’s Best Efficiency Point (BEP)—the operating point of maximum efficiency—as well as its required horsepower and Net Positive Suction Head Required (NPSHr), a critical parameter for avoiding cavitation.
- Piping Specifications: This includes detailed data on every pipe segment, such as its nominal diameter, schedule (which determines wall thickness), material of construction, and internal surface roughness. These parameters are non-negotiable inputs for fundamental fluid dynamics calculations, most notably the Darcy-Weisbach equation used to determine pressure drop due to friction.
- Vessel and Tank Data: This data includes the design specifications for all pressure vessels and storage tanks, such as their maximum allowable working pressure and temperature, total volume, and material of construction.
Electrical Data
This category covers the specifications for the electrical equipment that drives the process machinery. It includes detailed information on motors, such as their horsepower rating, voltage and amperage requirements, and operational efficiency curves, as well as the types of drivers used for pumps and compressors.
The Rules of Operation: Procedural and Historical Context
The final category of static data provides context not on the physical design of the plant, but on its intended and historical operation. This data codifies human knowledge and experience.
- Standard Operating Procedures (SOPs): SOPs are formal, written documents that provide detailed, step-by-step instructions for executing specific tasks. They are created to ensure that operations are performed with consistency, efficiency, and safety. A well-defined SOP includes its purpose (the “why”), the specific procedures to be followed, a list of all required resources (tools, equipment, safety gear), and a clear definition of responsibilities. SOPs represent the organization’s codified best practices and the intended context for how a process should be run.
- Maintenance History: This is a comprehensive log of all maintenance activities performed on each piece of equipment, typically stored in a Computerized Maintenance Management System (CMMS). It includes records of preventive, predictive, and corrective maintenance, detailing the dates of service, actions taken, parts replaced, and issues encountered. This historical data is invaluable for understanding an asset’s reliability, identifying recurring failure modes, and spotting trends in performance degradation over time.
The aggregation of this static data ecosystem represents the plant’s codified human expertise. A P&ID is the physical manifestation of the design engineer’s intent. A pump curve is the manufacturer’s guarantee of performance. An SOP is the operations team’s documented best practice. An AI model that operates in ignorance of this data is effectively ignoring decades of accumulated, hard-won engineering wisdom. The process of integrating this static data is therefore not merely a data engineering task; it is a knowledge engineering task. It involves translating these disparate documents, diagrams, and datasheets into a structured, machine-readable format. This process forces an organization to make its implicit knowledge explicit, a high-value activity that often uncovers inconsistencies, knowledge gaps, and process improvement opportunities long before a single line of AI code is written.44 The journey to building a context-rich AI system fundamentally improves an organization’s own understanding of its operations.
To clarify the distinct yet complementary roles of these data types, their characteristics are summarized in the table below.
| Attribute | Dynamic Time-Series Data | Core Static Data |
|---|---|---|
| Nature | Constantly changing, high-frequency, ephemeral | Fixed or infrequently changing, persistent |
| Time Dependency | Temporal; value is tied to a specific timestamp | A-temporal; value is generally independent of time |
| Source | Sensors, SCADA, DCS, Process Historians | Engineering drawings (P&IDs), datasheets, manuals, CMMS, SOPs |
| Represents | The as-operated state of the process | The as-designed state and physical constraints of the plant |
| Key Question Answered | "What is happening right now?" | "What is this system and what is it capable of?" |
| Typical Use Case in AI | Anomaly detection, forecasting, real-time monitoring | Providing context, defining physical boundaries, enabling causal reasoning |
| Examples | Temperature readings, pressure values, flow rates, vibration signals | P&ID layouts, pump performance curves, pipe diameters, motor horsepower, maintenance logs |
Part III: The Logical Derivation: Proving the Necessity of Context
Having established the fundamental dichotomy between dynamic time-series data and the static data universe, this section provides the analytical core of this report. It will construct a rigorous, step-by-step logical derivation to prove the central thesis: that AI analysis based solely on time-series data is inherently incapable of producing a true, actionable diagnosis for real-world industrial problems. Through a practical diagnostic scenario, it will be demonstrated how the systematic integration of static data transforms an AI from a simple pattern-matcher into a sophisticated diagnostic engine capable of emulating the deductive reasoning of an expert engineer.
The Engineer's Mind: A Framework for Diagnosis
To appreciate the shortcomings of a purely data-driven AI, one must first model the cognitive process of its human counterpart: the experienced process engineer. When confronted with an anomaly, an engineer does not simply observe a deviating trend line on a monitor in isolation. They interpret that dynamic data through a rich, pre-existing “mental model” of the plant. This mental model is a complex cognitive construct, a fusion of several layers of static knowledge: the topological layout of the equipment as depicted on the P&ID, a deep understanding of the physical capabilities and limitations of the machinery (such as the performance characteristics of a pump), and an experiential database of past events drawn from maintenance history and personal observation.
The engineer’s troubleshooting process is a form of hypothesis-driven, analogical problem-solving. They generate a set of plausible physical causes for the observed symptom, then systematically use their mental model to test each hypothesis against the available evidence, eliminating possibilities until a single, most likely root cause remains. A purely data-driven AI, by contrast, lacks this mental model. It operates on statistical correlation without physical comprehension. Its process is inductive, identifying patterns from data, but it is incapable of the deductive reasoning required for true diagnosis. IndustryOS® and its expert human process, therefore, serves as the gold standard that a truly intelligent, context-aware AI system must strive to emulate.
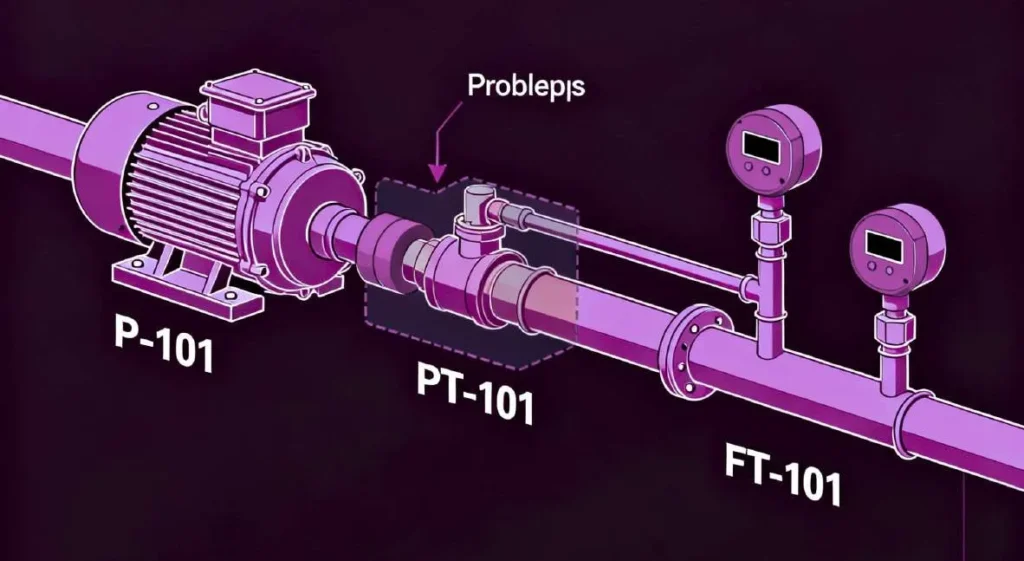
Diagnostic Scenario: Deconstructing a Pressure Anomaly in a Pumping System
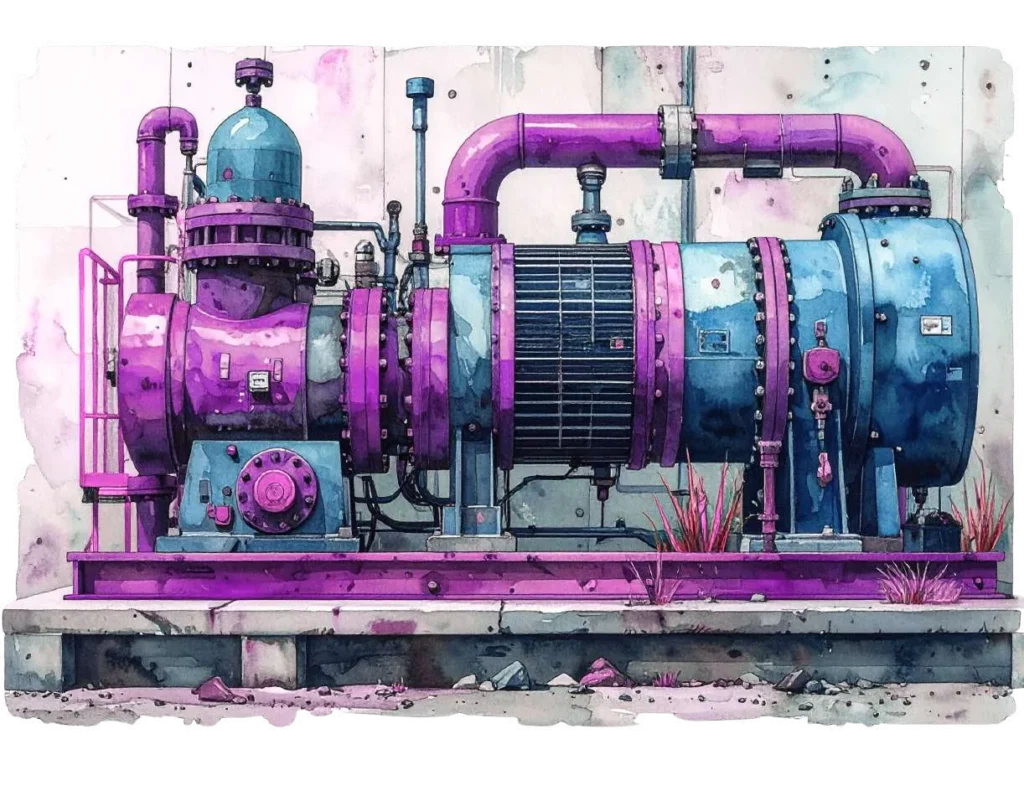
To illustrate this critical difference, consider a common process segment found in any plant, which can be represented by a P&ID. The system consists of a centrifugal pump (designated P-101) tasked with transferring a liquid from a source tank to a destination vessel. Downstream of the pump, a flow transmitter (FT-101) and a pressure transmitter (PT-101) are installed in the pipeline to monitor the process.
The anomaly begins when the plant’s control system registers a significant and sustained drop in the pressure reading from PT-101. Simultaneously, the reading from FT-101 shows a corresponding drop in the flow rate. Data from the pump’s motor indicates that its electrical current (amperage) draw has remained stable or even slightly decreased.
Step 1: The Time-Series-Only AI Analysis:
A conventional AI system, built on time-series analysis, will process the incoming data streams from PT-101 and FT-101.
- Action: An anomaly detection model, likely based on an advanced algorithm like an LSTM or Transformer, has been trained on months of historical data representing the “normal” operating state of this system. It continuously compares the live data stream to its learned patterns. Upon observing the simultaneous, sustained drop in both pressure and flow, the model correctly identifies this state as a statistically significant deviation from the norm.
- Conclusion: The model generates an alert for the operations team, which reads: “Anomaly Detected: Low Pressure, Low Flow at Unit 101.”
The Engineer's Mind: A Framework for Diagnosis
- A Failing Pump: The pump itself (P-101) is mechanically degrading or has failed, and is no longer capable of generating the required pressure (head).
- A Downstream Blockage: A partial or full obstruction has occurred in the pipeline downstream of the sensors, such as a valve that has failed to open or fouling inside the pipe, increasing the total system resistance.
- A Pipeline Leak: A breach has occurred in the pipeline between the pump’s discharge and the location of the sensors, causing a loss of both fluid and pressure.
For the operations team, these three possibilities require vastly different and urgent responses, from dispatching a maintenance crew to inspect the pump, to shutting down the line to clear a blockage, to initiating emergency containment procedures for a leak. The time-series AI, by providing only a generic alert, has failed to deliver the specific insight needed to guide this critical decision.

Step 2: The Context-Enriched Artificial intelligence (AI) ⇲ Analysis (The Engineer's Logic, Automated)
Now, consider a more sophisticated AI system designed to incorporate the static data universe. This system will follow a logical, deductive process that mirrors the reasoning of an expert engineer.
Integrating the P&ID: Establishing Topology
Upon receiving the initial anomaly signal from the time-series model, the context-enriched AI’s first action is to consult the plant’s digital P&ID.
- Action: The AI system queries its knowledge base for the tags PT-101 and FT-101. It retrieves the relevant P&ID sheet and parses the diagram to understand the system’s topology. It identifies that both instruments are located on the discharge line of pump P-101, which draws from a specific source tank and feeds a specific destination vessel. It confirms the piping layout, noting that there are no branches, bypasses, or alternative flow paths between the pump’s outlet and the location of the sensors.
- Inference: This step immediately provides crucial spatial context. The problem is isolated to the physical system comprising P-101 and its immediate discharge piping. The AI has constrained the problem space, eliminating countless other potential causes elsewhere in the plant.
- The Critical Failure: The model’s contribution ends here. It has successfully performed its function as a pattern recognizer—it has flagged what has happened. However, it has provided zero diagnostic value. The alert is ambiguous and not immediately actionable. The operations team is left with the same fundamental question they would have without the AI: what is the physical root cause of this condition? The model is incapable of distinguishing between the three most probable and distinct physical failure modes:
- Failing Pump: The pump itself (P-101) is mechanically degrading or has failed, and is no longer capable of generating the required pressure (head).
- Downstream Blockage: A partial or full obstruction has occurred in the pipeline downstream of the sensors, such as a valve that has failed to open or fouling inside the pipe, increasing the total system resistance.
- Pipeline Leak: A breach has occurred in the pipeline between the pump’s discharge and the location of the sensors, causing a loss of both fluid and pressure.
For the operations team, these three possibilities require vastly different and urgent responses, from dispatching a maintenance crew to inspect the pump, to shutting down the line to clear a blockage, to initiating emergency containment procedures for a leak. The time-series AI, by providing only a generic alert, has failed to deliver the specific insight needed to guide this critical decision.
Integrating Pump Performance Data: Testing the Prime Mover
The AI’s next logical step is to determine if the active machinery—the pump—is performing as expected.
- Action: The system retrieves the static pump performance curve for the specific model of pump P-101 from its asset database.36 It also pulls the real-time operational data for the pump’s rotational speed (RPM), which is assumed to be constant in this scenario. The AI then takes the current, anomalous readings for flow (from FT-101) and pressure/head (from PT-101) and plots this operating point directly onto the manufacturer’s curve.
- Inference and Diagnosis: This single action allows the AI to make a powerful diagnostic distinction.
- Scenario A (Failing Pump): The AI observes that the plotted operating point of (Flow, Pressure) falls significantly below the pump’s designated performance curve for its current RPM. This is a direct, physical indication that the pump is failing to deliver the pressure it was designed to generate for that specific flow rate. The pump is the source of the problem. The AI can now issue a highly specific diagnosis: “Pump P-101 Underperformance Detected. Operating point is 25% below manufacturer’s performance curve. Probable cause: internal wear, impeller damage, or seal failure.” The system could further enrich this diagnosis by cross-referencing the maintenance history from the CMMS, noting if the pump is overdue for service or has a documented history of similar failures.
- Scenario B (Blockage or Leak): The AI observes that the plotted operating point lies directly on or very close to the performance curve. This is an equally powerful piece of information. It means the pump is behaving exactly as designed. It is generating the correct amount of pressure for the amount of flow it is experiencing. Therefore, the pump is not the problem; the problem must be external to the pump, located within the piping system itself. The diagnosis is refined to: “System Issue Detected. Pump P-101 is operating on its curve. Root cause is downstream of the pump.”
Integrating Piping and Fluid Data: Applying First Principles
Having exonerated the pump in Scenario B, the AI must now differentiate between the remaining two possibilities: a blockage or a leak. To do this, it must apply fundamental principles of fluid dynamics.
- Action: The AI accesses the static engineering data for the pipeline segment between the pump and the sensors. This includes the pipe’s exact length, internal diameter, material, and associated surface roughness value. It also retrieves the physical properties of the fluid being pumped, such as its density and viscosity. Using these static parameters and the real-time flow rate from FT-101, the AI applies the Darcy-Weisbach equation to calculate the theoretically expected pressure drop due to friction across that specific length of pipe.
- Inference and Final Diagnosis: The AI compares its calculated theoretical pressure drop to the actual pressure drop measured in the system (the pressure at PT-101 relative to the pump’s discharge pressure, which is known from the pump curve).

- Scenario B1 (Blockage): The AI finds that the actual measured pressure drop is significantly higher than the theoretically calculated pressure drop. This indicates the presence of an unmodeled source of hydraulic resistance in the system—an obstruction. The AI can now issue a definitive final diagnosis: “Probable Downstream Blockage. Actual pressure drop exceeds calculated friction loss by 40%. Recommend inspection of pipeline and valves between P-101 and PT-101.”
- Scenario B2 (Leak): The AI finds that the flow rate measured at FT-101 is substantially lower than what the pump should be producing at the measured discharge pressure, according to its curve. While a single set of sensors makes this difficult to distinguish from a blockage with absolute certainty, a significant discrepancy between the pump’s expected output and the measured flow strongly implies a loss of inventory. If other sensors were available, such as acoustic sensors, they could be used to listen for the characteristic sound of a leak. The diagnosis becomes: “Probable Pipeline Leak. Flow rate is inconsistent with pump’s operating point on its curve. Recommend immediate line inspection for loss of containment.”
This diagnostic process is not a single prediction but a logical cascade of hypothesis testing and elimination. Each layer of static data—the P&ID, the pump curve, the piping specifications—acts as a physical constraint, progressively narrowing the field of possible causes. The AI moves from a vague observation of “what” is wrong to a specific, physically-grounded explanation of “why” it is wrong. This reveals that the true value of industrial AI lies not in its ability to forecast, but in its capacity to automate this complex reasoning process. A successful industrial AI is less like a statistical oracle and more like a tireless, data-driven diagnostic expert, constantly evaluating evidence against the unchangeable laws of the plant’s design and physics.
The following table starkly contrasts the diagnostic outputs of the two approaches, crystallizing the immense practical value gap between a context-blind and a context-aware AI system.
| Observed Anomaly (Time-Series Data) | Potential Root Causes | Diagnosis from Time-Series AI | Required Static Data for True Diagnosis | Diagnosis from Context-Enriched AI |
|---|---|---|---|---|
| Low downstream pressure, low flow | Pump Failure, Blockage, Leak | "Process Anomaly Detected." | P&ID, Pump Curve, Pipe Specs | "Pump P-101 operating 30% below performance curve. Probable internal wear." OR "Probable downstream blockage. Actual pressure drop exceeds calculated friction loss by 40%." |
| High motor vibration, stable P/T | Bearing Failure, Misalignment, Cavitation | "Vibration Anomaly Detected." | P&ID, Pump Curve (NPSHr), Maintenance History | "Pump P-205 operating off BEP, near NPSHr limit. Probable cavitation due to low suction pressure." |
| High temperature in reactor vessel | Cooling System Failure, Exothermic Reaction Runaway, Fouled Heat Exchanger | "High-Temperature Alert." | P&ID, Heat Exchanger Specs, Chemical Reaction Data, Maintenance Logs | "Cooling water flow normal, but heat transfer coefficient is 40% below design spec. Probable fouling in exchanger E-301." |
Part IV: Architectures of Synthesis: Building Context-Aware Industrial Artificial intelligence (AI) ⇲
Physics-Informed AI (PI-AI), and more specifically Physics-Informed Neural Networks (PINNs), represents a fundamental paradigm shift away from purely data-driven models. Instead of treating the learning process as a black box that discovers patterns from data alone, PI-AI embeds known physical laws directly into the model’s architecture. These laws, which can be expressed as differential equations governing principles like conservation of mass and energy or fluid dynamics, are often incorporated as a component of the model’s loss function. This forces the model’s predictions to not only match the observed data but also to adhere to the fundamental principles of physics.
The benefits of this approach in a manufacturing context are profound:
- Compensates for Scarce Data: One of the greatest challenges in industrial AI is the scarcity of data for failure or edge-case scenarios. It is prohibitively expensive and dangerous to run equipment to failure just to collect training data. PI-AI mitigates this problem by leveraging the “data” of established physical principles. The physics-based constraints guide the model’s learning process, restricting the solution space and dramatically reducing the amount of real-world training data required to achieve an accurate and reliable model.
- Prevents Physically Implausible Predictions: A purely data-driven model can learn spurious correlations that lead to physically nonsensical predictions. For example, it might suggest a control action that would violate the law of conservation of energy. PI-AI makes such outcomes impossible. By enforcing known physical models as a constraint, it ensures the AI does not learn anything that contradicts established scientific knowledge. This inherent guardrail is critical for maintaining safety and reliability in industrial applications.
- Improved Generalization and Adaptability: Because a PI-AI model’s “understanding” is grounded in first principles rather than just historical data patterns, it can generalize more effectively to novel scenarios and operating conditions it has not seen before. This makes the models more robust and adaptable to the dynamic nature of industrial processes, where conditions are constantly evolving.

The Industrial Knowledge Graph: Creating a Digital Nervous System
While PI-AI provides the intelligence for individual components, the Industrial Knowledge Graph provides the connective tissue for the entire plant. A knowledge graph is a dynamic, interconnected network that models real-world entities—such as machines, sensors, products, P&IDs, and maintenance logs—and, crucially, the rich relationships between them. It is a method for making the implicit context of a plant explicit, structured, and machine-queryable, effectively creating a digital nervous system for the facility.
Knowledge graphs are uniquely suited to the challenge of integrating disparate data types. They break down the rigid silos that typically separate OT and IT data. In a knowledge graph, a single entity, like “Pump P-101,” can be simultaneously linked to:
- Its location and connectivity, derived from a P&ID document (another entity).
- Its engineering specifications and performance curve data (as properties of the pump entity).
- Its complete maintenance history from the CMMS (a relationship to maintenance log entities).
- Its live, high-frequency time-series data streams for pressure, vibration, and temperature (a relationship to time-series data nodes).
The benefits of this integrated data model are transformative:
- Unified and Contextualized Data Access: By creating a single, unified data model, a knowledge graph provides a “single source of truth” for all asset and operational information. This eliminates the tedious and error-prone process of manually searching for information across dozens of disconnected systems.
- Semantic Search and Discovery: Knowledge graphs enable powerful semantic queries that understand relationships. Instead of searching for a tag name, an engineer can ask a complex question in natural language, such as, “Show me all heat exchangers downstream of Reactor R-201 that are made of stainless steel and have a maintenance history of fouling”. This capability dramatically accelerates troubleshooting and root cause analysis.
- A Foundation for Advanced AI: The knowledge graph serves as the ideal contextual data layer to feed more advanced AI and ML applications. By providing models with data that is already richly interconnected and contextualized, it improves their accuracy and enables more sophisticated reasoning, forming the core data structure for digital twins and other advanced analytics.

The High-Fidelity Digital Twin ⇲ : The Apex of Integration
The high-fidelity digital twin is the ultimate realization of a context-aware industrial AI system, representing the complete synthesis of static and dynamic data. A digital twin is far more than a 3D visual model; it is a living, virtual replica of a physical asset, process, or entire system that is continuously updated with real-time operational data. High-fidelity twins, in particular, are built upon integrated, multiphysics simulation models that capture the complex behavior of the underlying process.
The creation and operation of a digital twin is the culmination of all the concepts discussed in this report:
- The Foundation is Static: The process begins by building the static framework. P&IDs are digitized and converted into a structured, topological model. 3D models provide the spatial context, and detailed engineering specifications define the physical properties and performance constraints of every component.
- Animation with Dynamic Data: This static skeleton is then brought to life, or “animated,” with live, dynamic time-series data streamed directly from the plant’s sensors and control systems. This ensures the virtual model mirrors the real-world state of its physical counterpart in near real-time.
- This complete integration unlocks capabilities that are impossible with any other approach:
- Real-Time “What-If” Scenario Analysis: The digital twin acts as a safe, virtual sandbox. Before implementing a change in the real plant—such as altering a setpoint, changing feedstock, or modifying a control strategy—an operator can first simulate the change on the digital twin to predict its impact on production, quality, and safety. This ability to test scenarios virtually prevents costly operational errors and accelerates process improvement.
- Enhanced Operational Awareness: By consolidating information from dozens of disparate DCS screens, P&IDs, and data historians into a single, intuitive, and holistic interface, the digital twin provides operators and engineers with unprecedented situational awareness. This unified view enables faster, more informed, and more coordinated decision-making across the entire operation.
- Predictive and Prescriptive Power: The combination of a high-fidelity, physics-based model with real-time data allows the digital twin to not only predict future states with high accuracy but also to run optimizations in the virtual world to determine the best course of action. It can move beyond simply predicting a failure to prescribing the optimal control actions needed to prevent it, thereby maximizing efficiency, profitability, and safety.
The progression from PI-AI to knowledge graphs to digital twins should not be viewed as a choice between competing technologies. Rather, it represents a maturity model for developing truly intelligent industrial systems. They are complementary layers of a single, cohesive architecture. PI-AI serves as the foundational modeling layer, the “brains” that ensure the behavior of any individual component is physically sound. The knowledge graph is the “nervous system,” the connective tissue that links all the individual models and their data streams together, creating a plant-wide network of relationships. Finally, the digital twin is the “body,” the interactive visualization and simulation environment built upon the knowledge graph that allows humans to engage with this fully integrated, context-aware system. This perspective reframes digital transformation strategy: instead of pursuing a monolithic “digital twin project,” organizations should focus on a contextualization strategy that begins with building a foundational knowledge graph. The digital twin then becomes a natural, high-value application that consumes this pre-existing contextualized data, dramatically de-risking the initiative and accelerating the path to tangible value.
Part V: Strategic Recommendations and the Path to Autonomous Operations
The logical imperative for integrating static and dynamic data is clear. However, translating this understanding into a successful, enterprise-wide strategy requires a pragmatic approach that addresses not only technological challenges but also organizational and cultural hurdles. This final section provides actionable recommendations for implementing a context-aware AI strategy and offers a forward-looking perspective on how this foundation enables the ultimate goal of safe and efficient autonomous operations.
A Pragmatic Roadmap for Implementation
Embarking on the journey toward context-aware AI should be a phased, strategic process focused on building a solid foundation before deploying advanced applications.
Phase 1: Foundational Data Governance
The first and most critical step is not to purchase AI software, but to establish robust data governance and get the organization’s data house in order. The high failure rate of AI projects is often rooted in poor data quality and disconnected systems.19 This foundational phase must involve:
- Digitizing and Validating Core Static Data: Initiate a systematic effort to digitize essential engineering documents, particularly P&IDs, and convert them into a structured, machine-readable format.
- Ensuring Asset Information Integrity: Conduct an audit of asset information to ensure that equipment specifications, performance curves, and maintenance records are accurate and up-to-date. As less than half of industrial assets have current information, this is a critical and often overlooked step.
- Strengthening Data Historian Practices: Verify that the plant’s data historian is comprehensively and reliably capturing all critical real-time sensor data, and that this data is tagged with complete metadata (e.g., timestamps, batch numbers, operator IDs) to provide basic context.

Phase 2: Strategic Pilot Projects (Knowledge Graph Centric)
Rather than attempting a plant-wide rollout, begin with a small, high-value pilot project.
- Select a Critical Process Unit: Choose a single area of the plant that is well-understood and has a clear, pressing business problem (e.g., a unit with recurring downtime or quality issues).
- Build a Domain-Specific Knowledge Graph: Focus efforts on building a comprehensive knowledge graph for only this unit. This involves linking the digitized P&IDs, the validated asset data, and the relevant real-time data streams for that specific area.
- Demonstrate Value: Use this contextualized data to solve the targeted business problem. For example, deploy a root cause analysis tool that leverages the knowledge graph to diagnose a recurring failure mode. Successfully demonstrating a clear return on investment (ROI) in a contained pilot is the most effective way to build organizational support and secure funding for broader implementation.
Phase 3: Scaling and Upskilling
With a successful pilot completed, the focus shifts to scaling the solution and the organization’s capabilities.
- Expand the Knowledge Graph: Methodically expand the knowledge graph to encompass other process units, progressively building a unified data model for the entire facility.
- Invest in “Bilingual” Talent: A significant barrier to success is the skills gap between data science and plant operations. Invest in targeted upskilling and cross-training programs to create professionals who are fluent in both domains. These individuals are essential for translating operational challenges into data science problems and for validating the outputs of AI models against real-world engineering principles.
- Empower Subject Matter Experts: Deploy intuitive, user-friendly tools that allow experienced engineers and operators to contribute their deep domain knowledge directly to the AI system. This can involve creating interfaces where they can annotate anomalies, validate relationships in the knowledge graph, or codify procedural knowledge, making their expertise a scalable, persistent feature of the AI system.
Phase 4: Deploying Advanced Applications
Only after a rich, reliable contextual data layer (the knowledge graph) is in place should the organization deploy the most advanced AI applications. With this foundation, high-fidelity digital twins, closed-loop process optimization, and other sophisticated tools can be implemented with a much higher probability of success, as the fundamental data integration and contextualization problem has already been solved.

Overcoming Organizational Hurdles
The journey toward industrial AI is not primarily a technological challenge, but a change management and knowledge management challenge. The technology exists, but organizational structures and cultural mindsets are often the greatest barriers.
Historically, Information Technology (IT), which manages business systems, and Operations Technology (OT), which manages plant control systems, have operated in separate worlds. A successful context-aware AI strategy is impossible if this divide persists. Success requires the formation of dedicated, cross-functional teams comprising members from IT, OT, process engineering, and data science to ensure that systems are seamlessly integrated and that data can flow freely and securely between the plant floor and enterprise systems.
Building Trust through Transparency
Operator skepticism is a major obstacle to AI adoption. To overcome this, organizations must reject “black box” solutions. AI should be framed as a powerful tool that augments and amplifies human expertise, not one that seeks to replace it. Every recommendation or diagnosis generated by an AI system should be explainable and traceable. By leveraging architectures like knowledge graphs and physics-informed models, the system can provide the reasoning behind its conclusions, allowing a human expert to validate its logic against their own knowledge and experience, thereby building trust and fostering a collaborative human-AI partnership.
The Future Vision: From Predictive Insights to Prescriptive Control
The ultimate objective of building a context-aware AI infrastructure extends far beyond simply improving anomaly detection. The end goal is to evolve from predictive capabilities to prescriptive and, eventually, autonomous control.
- Predictive: “Based on rising vibration and temperature, Pump P-101 has a 90% probability of failing within the next 72 hours.”
- Prescriptive: “Pump P-101 is predicted to fail due to cavitation, identified by its operation off the BEP and near its NPSHr limit. To prevent failure, the system recommends increasing the level in the suction tank by 0.5 meters to increase suction head and throttling the discharge valve by 5% to move the operating point closer to the BEP.”
A system that possesses a deep, integrated understanding of the plant’s physical layout (from P&IDs), equipment capabilities (from performance curves), physical laws (from PI-AI models), and operational history (from maintenance logs) is the only viable foundation for achieving this level of prescriptive intelligence. It can make recommendations that are not only statistically probable but also physically sound, operationally feasible, and economically optimal.
This leads to the final conclusion: true operational autonomy is impossible without context. An AI system that is blind to the physical constraints and design intent of the process it is controlling cannot be trusted to make safe, reliable decisions. The integration of the static data universe is therefore not an optional upgrade for industrial AI; it is the mandatory prerequisite for its success and the only path toward a future of truly smart, resilient, and autonomous manufacturing operations. The most impactful strategic action a company can take is to create a unified, accessible, and trusted “single source of truth” for all asset and operational information. The Chief Data Officer or Head of Digital Transformation in a manufacturing company should therefore see their primary role not as an “AI implementer” but as a “knowledge unifier.” By focusing on building the foundational knowledge graph, they create the fertile ground from which all successful, context-aware AI applications will naturally and successfully grow.
Deep Technology | Consulting | Solutions
Comments are closed.