
India's Leading Chemical Manufacturer Adopts IndustryOS®
A comprehensive technical evaluation of the high-frequency Digital Twin integration mapping physical barriers, automating compliance, and optimizing process safety variables across 8 industrial chemical sites.
Deployments
8 Chemical Sites
Scan Speed
5 Milliseconds
Device Count
7,000+ Safety Units
Compliance
OSHA / CCPS
High-Speed Polling
High-Frequency Telemetry: Real-Time RAG Barrier Tracking
To prevent catastrophic containment losses in batch chemical processing, safety barriers must be monitored continuously. IndustryOS® replaces passive, lagging safety metrics with high-velocity polling that maps physical plant telemetry directly to risk-matrix baselines.
Active Edge Broker
OPC Unified Architecture Real-time Matrix
TAG SCAN RATE
55,030 / 5ms
PACKET RETRANSMISSIONS
0.00 %
SIM REACTOR A PRESSURE
4.24 bar
SIM MIXER SOLVENT FLOW
18.52 L/s

REAL-TIME PROCESS SAFETY VARIABLE LIMITS
High-speed data polling interrogates 55,030 active parameters every 5 milliseconds, capturing transient pressure spikes and runaway exothermic signatures before they breach critical thresholds.

Active Monitor Count
Continuous barrier tracking evaluates 7,000+ critical safety devices dynamically for real-time risk visibility.
Operational Architecture
Resolving the IT/OT Divide for Continuous Compliance
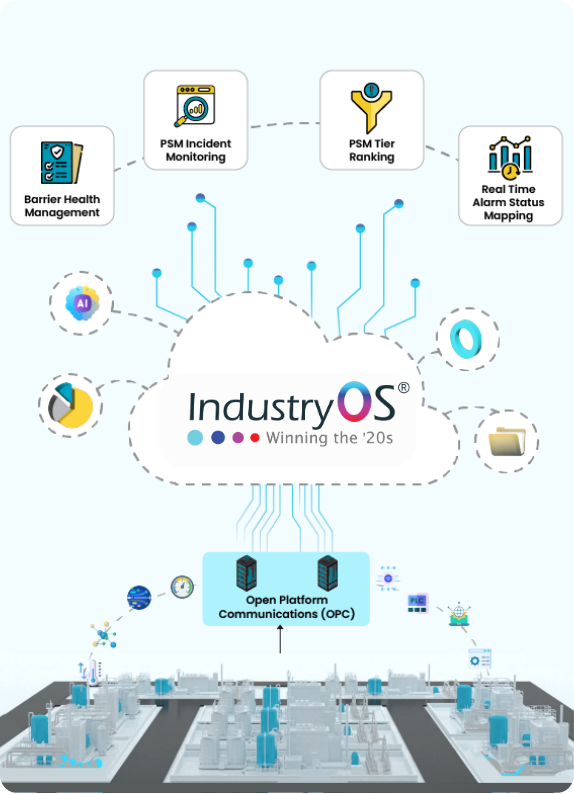
Figure 2: Unified Industrial Architecture linking Field Instrumentation directly to cloud analytics via OPC servers.
Siloed operational data restricts critical process safety variables (PSVs) to isolated localized control screens. IndustryOS® bridges the IT/OT gap by establishing a secure, high-integrity data pipeline from field instrumentation and PLCs/DCS up through an enterprise OPC UA server into a unified compliance engine.
This architecture normalizes unstructured time-series data at the edge, converting raw physical telemetry—such as exothermic reactions, vapor space pressure, and hazardous fluid velocities—into unalterable, audit-ready regulatory logs.
OPC DA/UA Protocol Consolidation
Eliminates industrial data silos by aggregating disparate telemetry from legacy Modbus, Profibus, and modern OPC UA architectures into a singular, cyber-secure process safety data stream.
Real-Time Independent Protection Layer (IPL) TrackingMoves past static Layers of Protection Analysis (LOPA). The platform continuously validates active risk-reduction factors ($PFD_{avg}$) by monitoring the online availability, proof-testing intervals, and bypass statuses of physical safety barriers.
ISA-95 Taxonomy Alignment for EHS Enterprise AuditingMaps physical plant sensor tags directly to corporate safety hierarchies. This ensures that a localized alarm or barrier degradation instantly updates the asset integrity dashboard at both the facility and corporate EHS levels.
Visual Process Safety
First in India: Interactive ANSI-Enabled Digital P&IDs
Traditional Process Hazard Analysis (PHA) and Management of Change (MOC) workflows are often slowed down by static paper drawings and flat PDFs. Sparrow infinity introduces India’s first ANSI data set-enabled Digital P&ID mapping ecosystem, transforming static engineering schemas into interactive spatial databases that update in real time based on active field metrics.
During pre-startup safety reviews (PSSR) or live operations, engineers can click any valve, line, or vessel within the P&ID layout to view its real-time operating envelope, historical inspection intervals, and critical safety barrier interlocks.
Interactive Asset & Barrier Mapping
Layer real-time Process Safety Variables (PSVs)—such as pressure, temperature, and flow—precisely onto spatial schemas. Instantly visualize the health, bypass status, and test intervals of Safety Instrumented Functions (SIF) directly within the piping layout.
Reduced Human Error
Context-enriched operational parameters reduce operator cognitive strain during critical process alarms. Instead of cross-referencing multiple separate SCADA screens and paper folders, operators see the exact root-cause hazard located on a unified spatial diagram.
Real-Time Safe Operating Envelope (SOE) Enforcement
Every tag on the digital P&ID flashes color-coded warnings (RAG status) the moment a physical parameter drifts toward Upper or Lower Safe Operating Limits ($USL$ / $LSL$), preventing mechanical stress or loss of containment.
MOC Cycle Validation
Eliminates undocumented field modifications. Any physical change or safety bypass validated through the Management of Change (MOC) protocol is digitally updated across the entire P&ID matrix, ensuring the engineering baseline matches the physical plant floor.

Figure 3: Interactive schematic representation of chemical piping configurations and valve control metrics.

Figure 4: Real-time alarm clustering, warning status heatmaps, and hazard densities.
Mitigating Alarm Fatigue
Real-Time Alarm Status Mapping & Heatmaps
Cascading alarms during a process drift often overwhelm control room operators, burying primary hazard indicators under hundreds of non-critical system notifications. IndustryOS® resolves this critical human-factor challenge through multivariate alarm correlation modeling.
IndustryOS® resolves this operational risk by embedding a multivariate alarm correlation model fully compliant with ANSI/ISA-18.2 (Management of Alarm Systems for the Process Industries) standards.
By analyzing historical trends and cross-zonal deviations, the platform's AI models prioritize alerts based on actual physical risk and barrier degradation. This visual topology allows operators to isolate process drifts instantly, identifying failing barriers before an Emergency Shutdown (ESD) sequence triggers.
“
"By mapping alarm density and tracing root process variations instantly, localized teams prevented complex safety incidents and reduced emergency shutdowns by 30%.""
Dynamic Alarm Rationalization & Suppression
Spatial Hazard Density Heatmaps
Pre-emptive Barrier Degradation Alerts
Process Control & Quality
Real-Time Quality Metrics & Compliance Registry
To maintain high quality and prevent off-spec batches, the platform monitors critical parameters continuously. It runs real-time calculation models to evaluate the process capability ratio ($C_p$) and minimum process capability index ($C_{pk}$):
Process Stability Index Formula
$$C_{pk} = \min\left(\frac{USL - \mu}{3\sigma}, \frac{\mu - LSL}{3\sigma}\right)$$
Any statistical variation indicating drift toward specification limits ($USL$ or $LSL$) immediately alerts process engineers, allowing proactive adjustments. Additionally, the platform logs compliance safety observations, near-misses, and Permit to Work (PTW) checklists into an unalterable database.
20% Boost
Average Overall Equipment Effectiveness (OEE) optimization.
100% Audit
Automated and unalterable compliance recording logs.
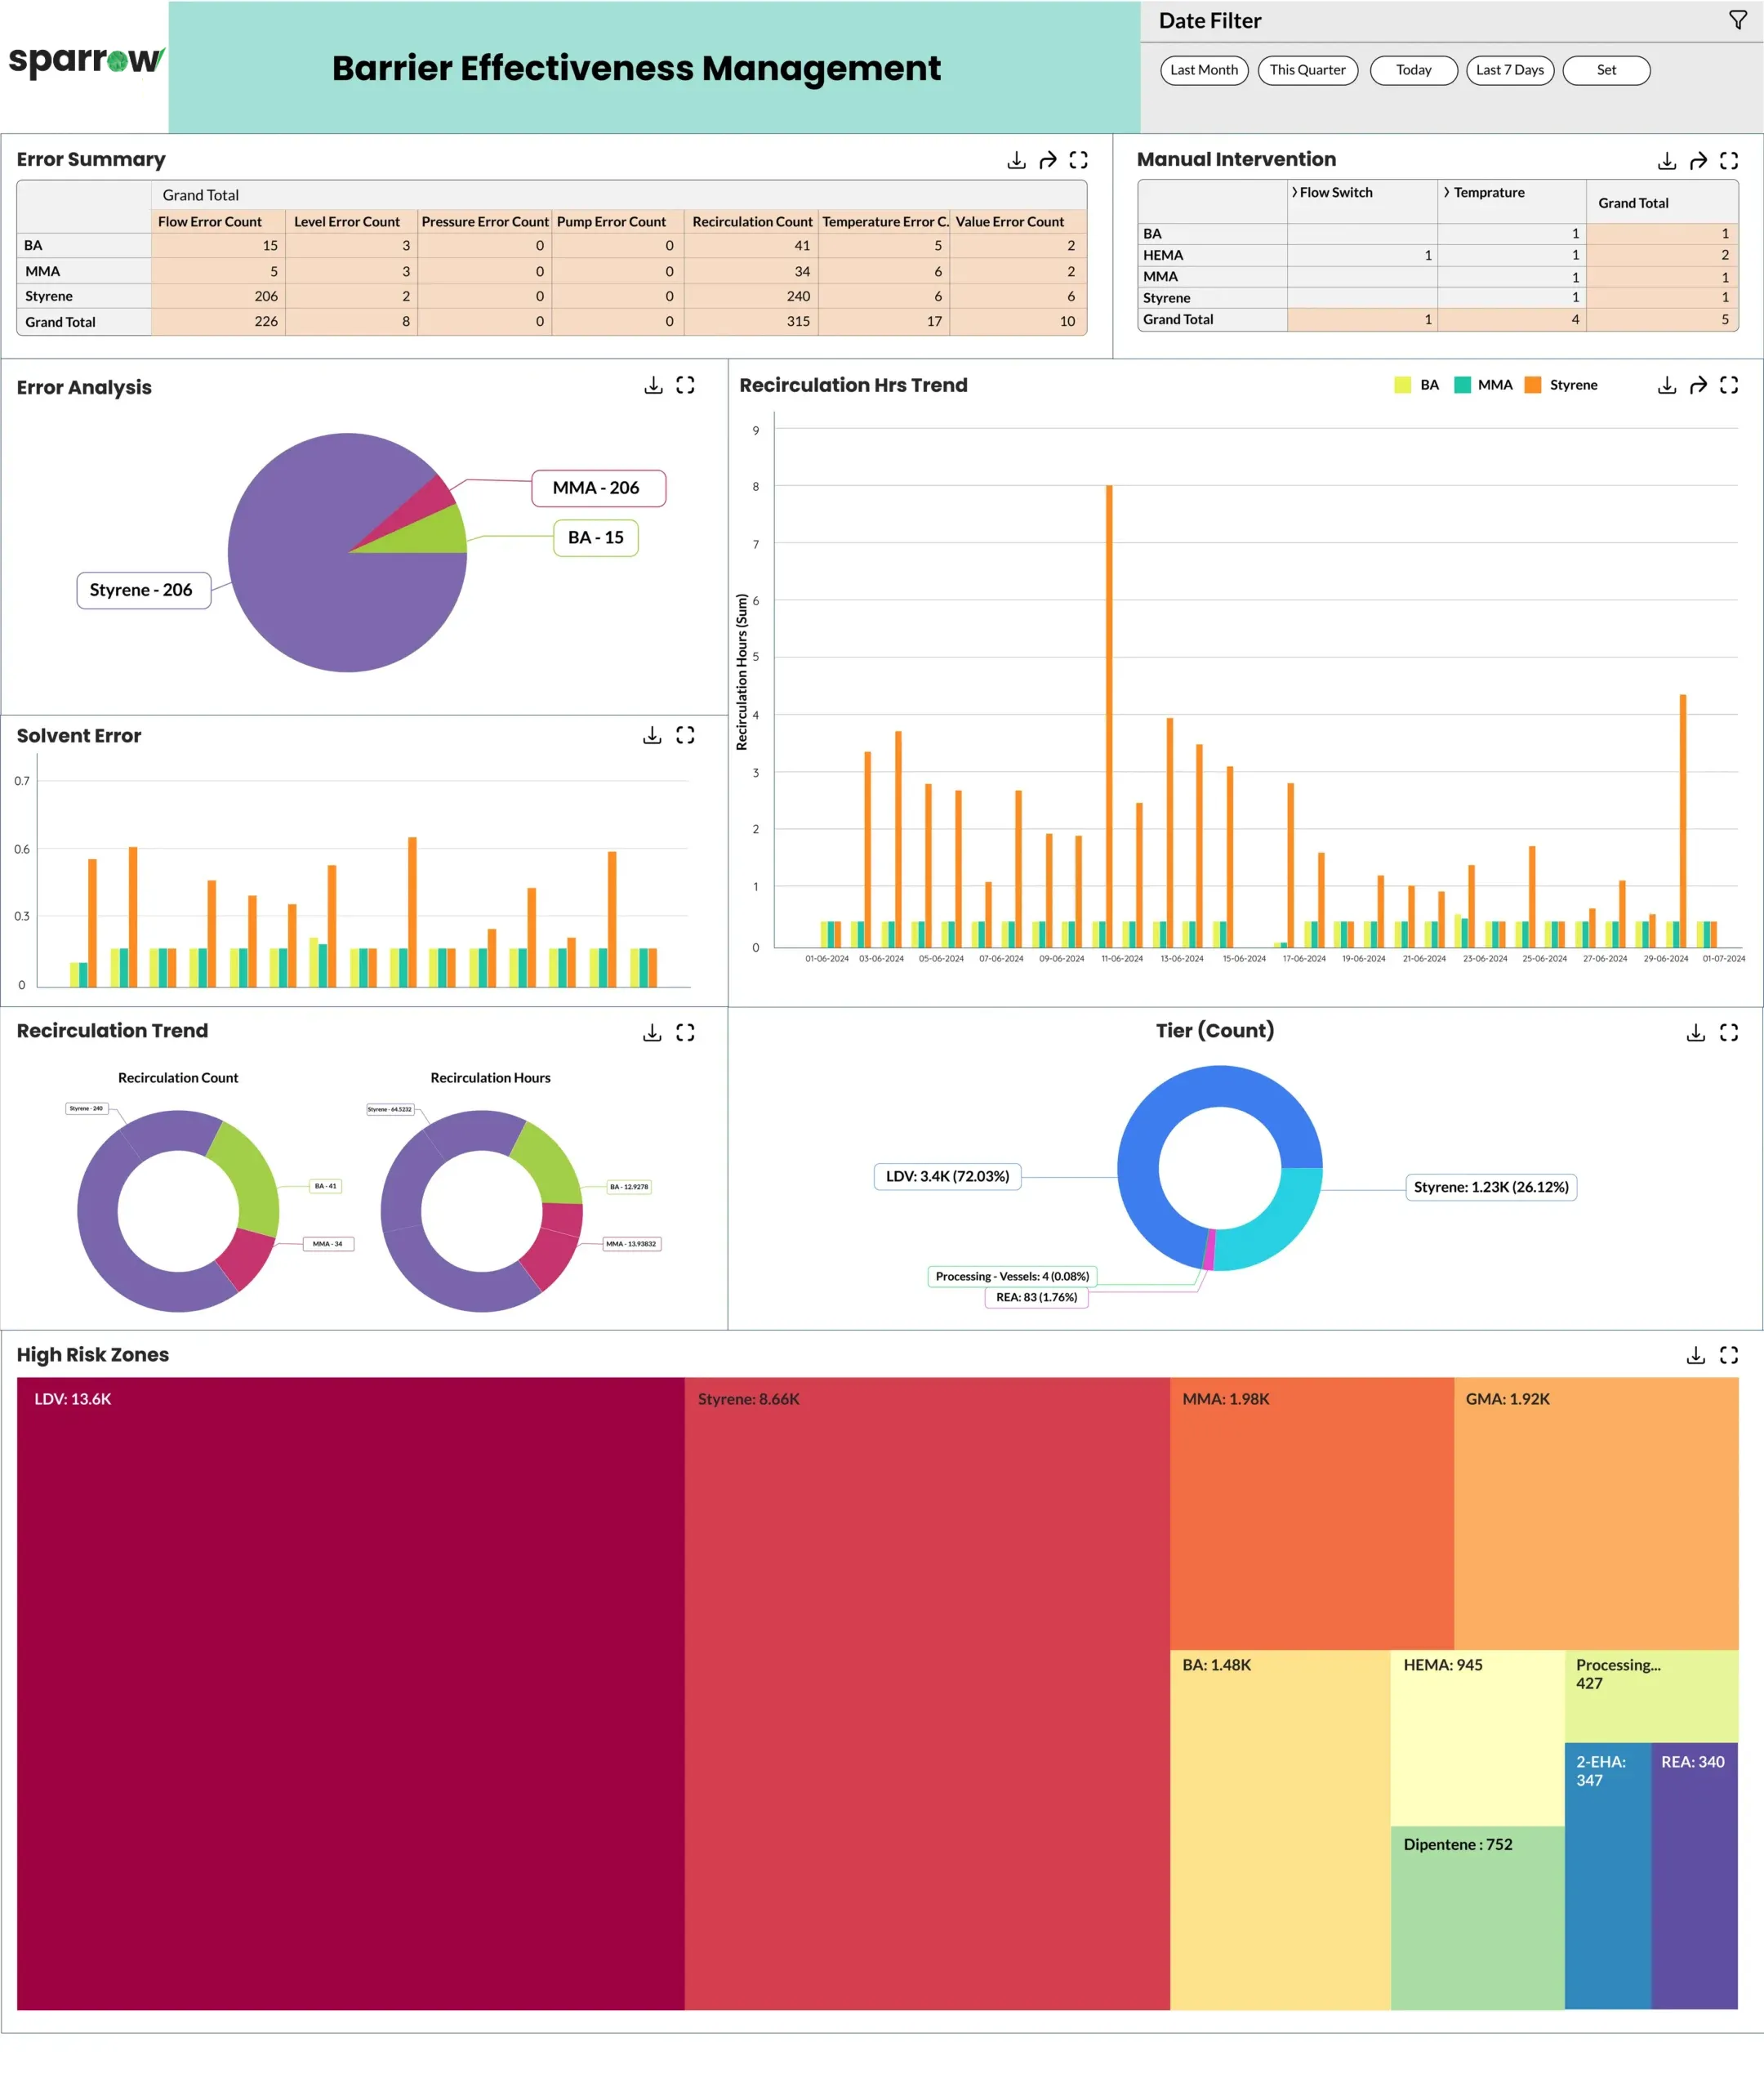
Figure 5: Compliance dashboards tracking real-time safety records, barrier health, and near-miss variables.
Redefining Industry Standards
Redefining Industry Standards: The State of the Art hyPSM® Model
Built upon a proprietary 6-step, 10-stage hybrid safety framework, Sparrow’s hyPSM® platform integrates raw instrumentation datasets with established chemical safety methodologies like HAZOP, LOPA, and Quantitative Risk Assessment (QRA).
The 6-Step, 10-Stage Risk Orchestration Architecture:
- Dynamic Baseline Integration: Connects HAZOP and LOPA studies with live field data, converting static risk assessments into real-time risk tracking.
- QRA Automation: Continuously evaluates risk using equipment condition, valve activity, and process deviations instead of periodic assessments.
- Functional Safety Lifecycle Management: Monitors safety systems throughout their lifecycle and flags gaps between designed SIL and actual reliability (PFDavg).
- Predictive IPL Validation: Automatically validates protection layers and recalculates risk when safety barriers are bypassed or under maintenance.

Figure 6: Professional control room display running active hyPSM® Digital Twin monitoring.
Comments are closed.