
Validating the New Architecture of ESG: From Manual Reporting to Real-Time Optimization
Validating the New Architecture of ESG: From Manual Reporting to Real-Time Optimization
An Analysis of Integrated Platforms, IT/OT Convergence, and Real-Time Data
Executive Summary: The Shift to Technology-Driven ESG
How do you move from manual Excel spreadsheets to automated, real-time sustainability reporting? This case study explores the new architecture of ESG, driven by IT/OT integration and IndustryOS®.
This report validates the hypothesis that the future of Environmental, Social, and Governance ESG Data Architecture performance is inextricably linked to a new technological architecture. An exhaustive analysis of the Sparrow industrial technology ecosystem, as detailed in its technical documentation and online-facing materials, serves as a definitive case study. It proves that the future of ESG is a fundamental shift from a compliance-driven, manual reporting function to a technology-driven, real-time optimization engine.
This transformation is enabled by three interconnected pillars of technology, all in clear evidence in the Sparrow platform:
The 3 Pillars of Modern ESG Architecture (Application, IT/OT, True Accounting)
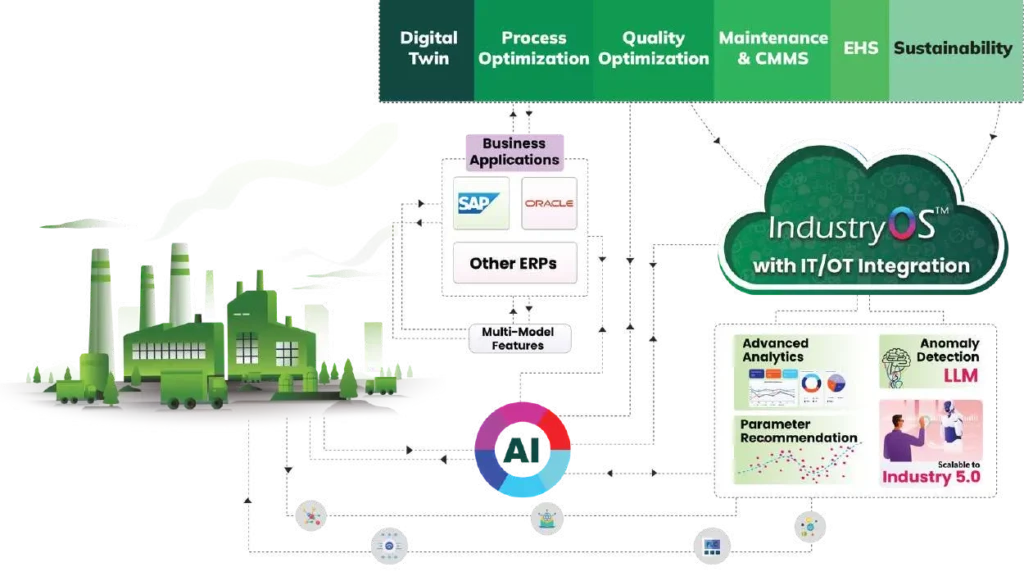
Integrated Software (The Application Layer): The GroundESG® platform, powered by IndustryOS®, functions as the “one-stop shop solution”. It is the application layer for data aggregation, advanced analytics, dashboarding, and stakeholder reporting, aligned with global standards.
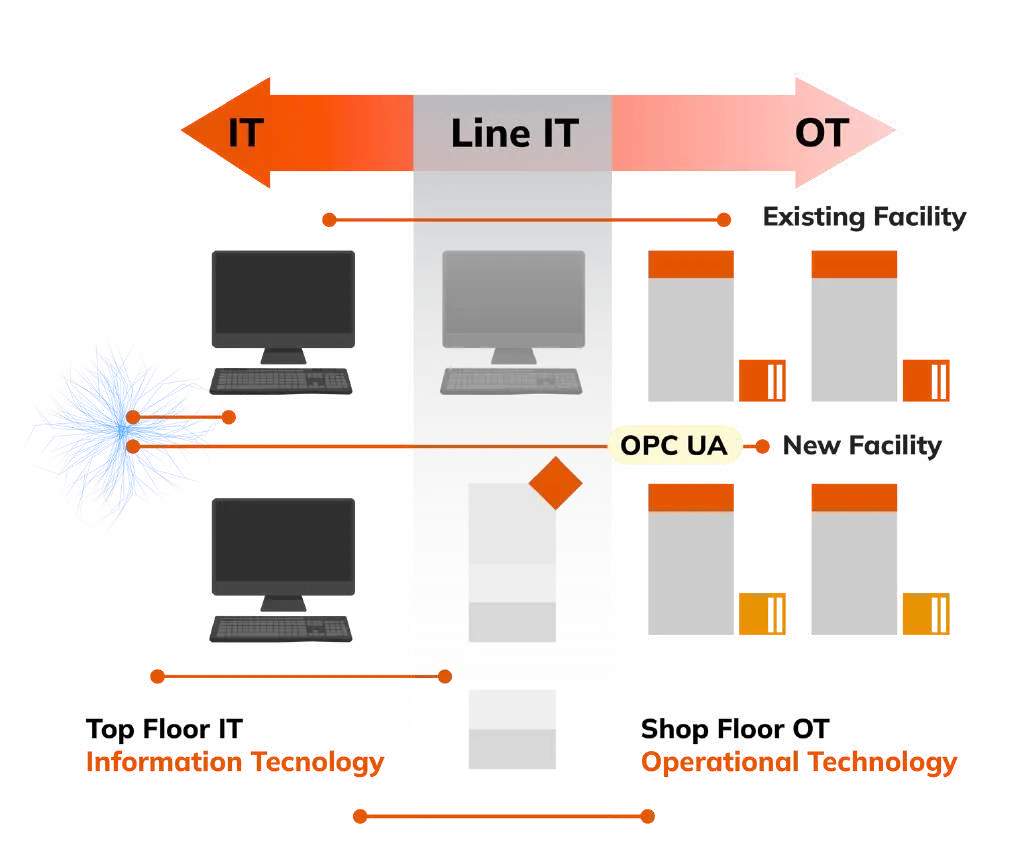
IT/OT Integration (The Foundational Layer): The IndustryOS® platform serves as the foundational industrial operating system.1 This is the critical data fabric that bridges high-level “Top Floor IT” systems (like SAP and Oracle) with granular “Shop Floor OT” (Operational Technology), including PLCs, DCS, and SCADA systems.
True Accounting (The Process Layer): This architecture enables a real-time data processing engine that automates emissions accounting, as evidenced by the formula Real Time Consumption Monitoring X GHG Emission Factor. This process is designed to function “without any manual intervention,” providing a verifiable, auditable, and continuous flow of data.
This report will demonstrate how this three-pillar architecture moves ESG from a lagging indicator (a static, historical report) to a leading, actionable parameter. The analysis will show that this integration is the only viable path to solving “The Most Complex Function To Crack” —an equation that mathematically binds sustainability outcomes to core operational metrics like Overall Equipment Effectiveness (OEE). This integrated architecture is the essential prerequisite for achieving the future-state goals of “AI-based ESG optimization” and true, data-driven “Product Stewardship”.
The Paradigm Shift: From Static Reporting to Dynamic Optimization
The strategic documents presented by Sparrow outline a clear and necessary evolution, moving the entire concept of ESG management from a passive, archival state to an active, predictive one. This transition maps directly to the user’s hypothesis, establishing the business and operational necessity for a new technological foundation.
Current vs. Future State: Moving Beyond "ESG Data Debt"
Data Ingestion: The dominant method is “Manual or Software data ingestion”. This reliance on periodic, human-driven data entry is further evidenced by the “Upload Excel” functionality, which, while necessary for some data types, represents a significant bottleneck for real-time operations. This method is inherently slow, consumes significant human resources, and is highly susceptible to error.
Data Management: The primary technological function is a “Document repository for audits”. This defines ESG data not as an operational asset but as an archival liability. The goal is not optimization but to pass a compliance check. This creates a high-stakes environment where data is stale on arrival, and the organization is perpetually looking in the rearview mirror.
The Inevitability of Greenwashing: A system built on these foundations—manual ingestion, stale data, and compliance-focused repositories—is inherently vulnerable to the risks of “greenwashing,” an issue the documentation explicitly calls out. When data is not auditable back to its source, and estimations are used to fill gaps, the resulting reports lack integrity. “True accounting” is impossible in this “Current” paradigm.
The "Future" State: ESG as an Integrated, Optimized Function
In stark contrast, the “Future” state outlined is a complete re-imagining of ESG as a core business function, fully integrated with operations and strategy. This future vision, which is the technological model Sparrow is building, directly validates the user’s hypothesis.
Data Ingestion: The “Current” manual process is decisively replaced by “IT-OT integration” and direct “Integration with SCADA/PLC/DCS”.1 This is not a theoretical goal; the GroundESG® platform is marketed on this exact capability, promising “seamless IT/OT data integration” and “Real-Time Data – PLC / DCS Integration”. This shift moves data collection from a monthly, human-driven task to a continuous, machine-driven flow.
Data Management: The static “Document repository” evolves into dynamic, predictive “Digital twin models for emissions and energy flows”.1 In this model, data is no longer a static number in a cell; it is a live, contextualized, and virtual representation of the physical operation. This allows for simulation, “Scenario modelling” (the “Intermediate” step), and prediction.
Data Application: The ultimate purpose of the data changes. The “Current” goal of “Regulatory, Compliance dashboards” is superseded by the “Future” goal of “AI-based ESG optimization” and, most significantly, “Closed-loop control for sustainability”. This signifies a system intelligent enough to not only report a deviation but to recommend or even execute an operational change (e.g., in a process or energy source) to return to an optimized, sustainable pathway.
This chasm between the “Current” and “Future” states is not an incremental gap. It is a fundamental architectural break. It cannot be bridged by simply buying a new “ESG software” application. It requires a new foundational data platform. This implies a two-stack solution: an application stack (GroundESG®) to service the ESG user and a platform stack (IndustryOS®) to re-architect the underlying industrial data flow. The hypothesis can only be fulfilled when both stacks are present and seamlessly integrated.
Table 1: The Evolution of ESG Data & Technology (Current vs. Future)
The following table synthesizes the paradigm shift detailed in the “The Focus” framework 1 and other supporting sections.
| Capability Domain | Current State | Future State |
|---|---|---|
| Data Ingestion | "Manual or Software data ingestion". Relies on "Upload Excel". | "IT-OT integration", "Integration with SCADA/PLC/DCS". "Seamless IT/OT data integration". |
| Key Technology | "Document repository for audits". | "Digital twin models for emissions and energy flows", "AI, ML for optimization". |
| Core Function | "Emissions reporting (GHG protocols)", "Regulatory, Compliance dashboards". | "AI-based ESG optimization," "Closed-loop control for sustainability". |
| Data Scope | "Scope 1, 2, and partial 3". | Full "Supply chain impact tracking". "LCA Models in Real Time". |
| Business Goal | Pass Audits. Historical reporting. | "Drive operational excellence". "Predictive sustainability analytics". |
The Foundational Fabric: Deconstructing IndustryOS® and the IT/OT Integration Framework
The transition from a “Current” manual state to a “Future” automated state is not academic. It requires a specific, powerful, and deeply integrated technical foundation. The documentation makes it clear that the GroundESG® application is “Powered by IndustryOS®“. This distinction is critical: IndustryOS® is the essential industrial operating system, the foundational fabric that makes the real-time data integration hypothesized by the user possible.
IndustryOS®: The Platform for Convergence
IndustryOS® is presented as the solution for “Manufacturing Excellence,” covering “Operations | Maintenance | Quality | EHS | Sustainability”. This reveals that the same platform built to optimize operations is the platform that enables ESG. Sustainability is not an “add-on” but a native function of the core operating system.
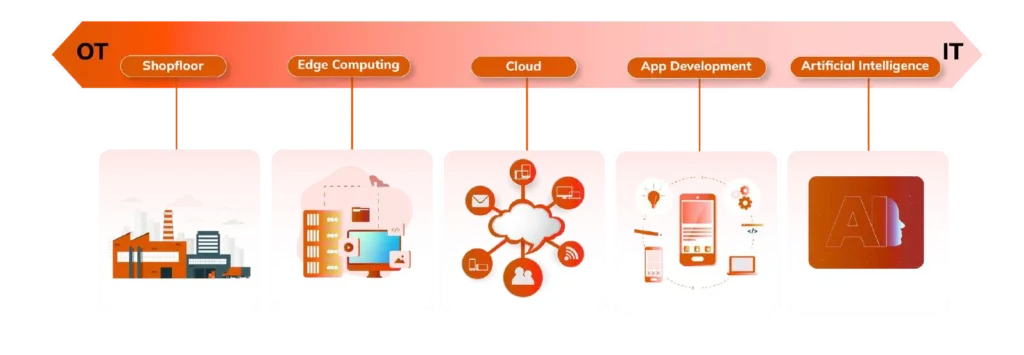
This platform’s primary role is to serve as the hub for convergence, the central point where all data streams meet. The architecture is explicitly designed to connect the “Top Floor IT” (the world of business planning) with the “Shop Floor OT” (the world of physical production).
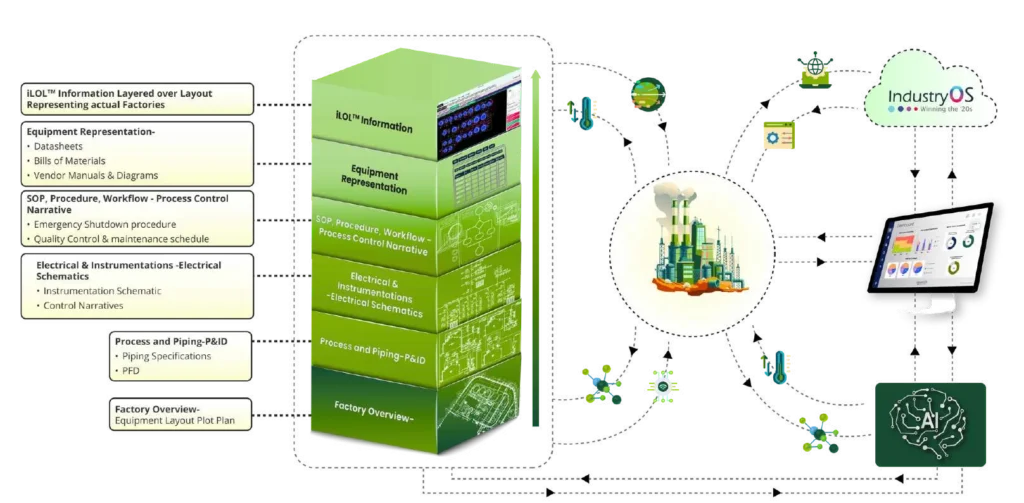
The "iLOL" Concept: The Context Engine for Data
The technical documentation reveals that IndustryOS® is “built on iLOL – information Layered over Layout”. This concept is visually detailed as a digital twin of the factory, with “Layers of Information on One Platform”.1 This “iLOL” framework is the core enabling technology for “true accounting.”
A piece of data from a “Shop Floor OT” source, such as a “PLC, DCS, OPC UA, IOT Sensors” , is, by itself, just a number (e.g., “Sensor 42: 200 kW”). This data is meaningless for specific ESG accounting without context.
Simultaneously, a piece of data from a “Top Floor IT” system, like “SAP” or “Oracle” , is also just a piece of business information (e.g., “Production Order 77: Product B, Batch 100”).
The “iLOL” framework is the contextualization engine that fuses these streams. It maps “Sensor 42” to a specific, named asset in the “Plant CAD Layout” (e.g., “Motor on Production Line 3”). The IndustryOS® platform, integrating with the IT systems, knows that “Production Line 3” is currently processing “Production Order 77.”
Therefore, the system can, in real-time, attribute the 200 kW of energy consumption directly to Product B, Batch 100. This automatic, real-time attribution is the absolute prerequisite for accurate, per-unit emissions tracking, “SKU & Line Specific Analytics” , and “Digital twin models for emissions”. This is the “realtime data integration from shopfloors.”
Deconstructing the IT/OT Data Bridge
The diagram on page 17 of the Sparrow Deck is the definitive technical proof of the user’s hypothesis. It visualizes a “hub-and-spoke” model where IndustryOS® is the central hub.
- “Shop Floor OT” (Inputs): This layer includes all sources of real-time operational data: “PLC, DCS, OPC UA, IOT Sensors”. This is the high-velocity, high-volume data stream from the “Existing Facility” or “New Facility”.
- “Top Floor IT” (Inputs): This layer includes the “Business Applications” that provide business context: “SAP, ORACLE”. This is the source of production orders, raw material specifications, maintenance schedules, and quality parameters.
- The Hub (IndustryOS®): This central platform, built on “iLOL,” ingests data from both IT and OT. It normalizes, contextualizes, and stores this fused data, creating a “single source of truth.” It is the “Backbone for AI & Advanced Analytics”.
- The Application Layers (Outputs): Sitting on top of this unified data hub are the various applications that “win the ’20s”. These include “Analytics & AI,” “Work Flow,” and, by extension, GroundESG®.

This architecture provides a clear “platform play.” Sparrow is not just an “ESG software” vendor; it is an industrial platform company, for whom ESG is a critical application. The very same integrated IT/OT data captured by IndustryOS® to enable “OEE Management” and “Cp & CpK charts” for quality is the exact same data consumed by the GroundESG® module for sustainability accounting.
This reusability of data across operational silos (Operations, Quality, Maintenance, and Sustainability) is the ultimate efficiency. It embeds sustainability not as a separate, parasitic data-gathering effort but as a native function of the core digital operating system.
Table 2: Deconstruction of the IndustryOS® ⇲ , IT/OT Integration ⇲ Framework
This table provides a layer-by-layer deconstruction of the technology stack, based on the diagrams and text on pages 16, 17, 19, and 21.
| Stack Layer | Components | Primary Function |
|---|---|---|
| Layer 1: Data Source (OT) | PLC, DCS, SCADA, OPC UA, IoT Sensors. | Capture real-time, high-velocity machine, process, and energy data from the shop floor. |
| Layer 2: Data Source (IT) | SAP, Oracle, Business Applications. | Provide business context: production orders, raw material specs, maintenance work orders, compliance. |
| Layer 3: Platform (Context) | IndustryOS®, iLOL® – information Layered over Layout. | Integrate, normalize, and contextualize IT/OT data streams against a digital twin layout. Creates the "single source of truth." |
| Layer 4: Application (ESG) | GroundESG®. | Consumes the unified, contextualized data for automated ESG accounting, analytics, and reporting. |
| Layer 5: Application (Ops) | OEE Management , TQM (Cpk Charts) , Maintenance Logs. | Consumes the unified data for operational performance monitoring and optimization. |
| Layer 6: Analytics (AI) | Analytics & AI, Sparrow AI Labs. | Consumes unified data for predictive analytics, "Anomaly Detection", and "AI-based ESG optimization". |
How IndustryOS® Enables Real-Time GHG Accounting
The “Future” state of ESG requires more than just integrated data; it demands “true accounting” [User Query]. The Sparrow documentation provides the precise mechanism for this, moving GHG accounting from a process of manual estimation to one of automated, auditable calculation.
The Role of Digital Twins in Sustainability
“True accounting,” in this context, is defined by its core attributes:
Automated: Data is captured “without any manual intervention”.
Auditable: Data is sourced directly from a system of record (e.g., a PLC or DCS), providing an immutable audit trail.
Real-Time: Data is collected, calculated, and reported continuously, not in periodic batches.
Contextualized: Data is attributed to specific assets, lines, or products, as enabled by the iLOL framework.

Integrating Scope 1, 2, and 3 Emissions Data
The Auto-Accounting Formula
Page 23 of the Sparrow Deck provides the explicit formula that functions as the “engine” of “true accounting” for Scope 1 and 2 emissions:
Real Time Consumption Monitoring X GHG Emission Factor = GHG Accounting & Reporting Scope – 1 & 2
This simple equation is the culmination of the entire IT/OT architecture. Its components are:
- Real Time Consumption Monitoring: This variable is not manually entered. It is the output of the IndustryOS® IT/OT integration framework detailed in Section II. The documentation explicitly states this is achieved via “Integration with DCS/PLC/MES/ERP”. This is the auditable, machine-level data (e.g., “Furnace_1 consumed 100 m³ of natural gas,” “Line_2 consumed 500 kWh of electricity”) captured in real-time.
- GHG Emission Factor: This variable is provided by the system, which contains an “Emission Factor Database” (e.g., “IPCC, DEFRA, USEPA“). This ensures that the calculations are “Aligned to Latest Global Standards”.
- GHG Accounting & Reporting: The IndustryOS® platform performs this calculation continuously. The result is the “Auto-Accounting of Scope-1 & 2 Emissions” , which is then automatically populated in the GroundESG® database and visualized on dashboards.
This automated process replaces a human-driven, batch process (e.g., a plant manager exporting a spreadsheet, sending it to the EHS team, who then manually VLOOKUP emission factors and populate a master report) with a machine-driven, real-time one. This eliminates errors, frees up human capital, and provides an auditable data trail “without any manual intervention”. This is the very definition of “true accounting.”
The "Hybrid" Data Model
The GroundESG® platform is also pragmatic, recognizing that not all ESG data can be automated via a PLC. The “ESG Data Aggregation” interface on page 14 reveals how this automated data lives alongside other essential ESG metrics.
The platform provides a “one-stop shop solution” by combining data streams. While consumption of “Non-Renewable Fuels” can be automated via the “Real Time Consumption Monitoring” formula , other critical data for “Waste Management,” “Water,” “Compliance,” and “Safety MIS” may still require semi-manual input.
For this “hybrid” data, the platform provides user-friendly interfaces (“Upload Excel,” “Add Flow”).1 Crucially, it also governs this manually-entered data using “Auto Anomaly Detection” to “automatically identify & address data irregularities” and a “Visibility on Doer & Checker Side” workflow.
This hybrid approach is essential. It provides a single platform to manage the entire ESG data portfolio—the fully automated, real-time data from IT/OT integration, and the less-frequent, manually-governed data required for a complete report.

The Core Integration Model: Solving the "Most Complex Function" of Sustainability
The user query places special emphasis on the integration model, for which page 12 of the Sparrow Deck provides the definitive blueprint. This diagram is the synthesis of the entire system. It demonstrates the application of the IT/OT architecture (from Section II) and the “true accounting” engine (from Section III) to solve the ultimate business problem: integrating sustainability directly into operations.
Deconstruction of the Page 12 Integration Model
The diagram on page 12, “How To Achieve This?”, shows GroundESG™ (powered by IndustryOS®) as the central hub connecting four distinct, real-time data models.
- RM Impact – LCA Models in Real Time: This represents the “Inbound” value chain. This is not a static, one-time study. It is a real-time model that calculates the environmental impact of raw materials as they are being consumed. This requires real-time consumption data, which is provided by the…
- Factory Model on IndustryOS® – OEE | Quality | Availability | Maintainability: This is the core operational data captured by the IndustryOS® IT/OT integration (detailed in Section II). It is the digital twin of the factory floor, providing the high-frequency data on operational performance. This is the source data that feeds the other models.
- End of Life – LCA Models in Real Time: This represents the “Outbound” value chain. This model is essential for achieving true circularity and “Product Stewardship” , modeling the impact of a product after its use.
- APIs like SuperProcure: This represents integration with external, third-party systems. SuperProcure is noted as a logistics/procurement platform. This integration is the technical enabler for tracking “Upstream” and “Downstream transportation & distribution” (Scope 3 Categories 4 & 9) and is critical for “Supply chain impact tracking”.
- GroundESG®, powered by IndustryOS®, acts as the integration bus, consuming, processing, and connecting these four data models to create a single, holistic view of sustainability.
The Sustainability Equation: The "Grand Unification" Formula
The following page of the deck presents “The Most Complex Function To Crack”. This equation is the mathematical and logical proof of the user’s hypothesis:
$f(\text{out, Sustainability}) = f(\text{LCA RM, Opt Log Rm, OEE, Opt Log Out, LCA out})$
This equation is a “grand unification” formula for industrial sustainability. Its implications are profound:
Sustainability is a Dependent Variable: It states that “Sustainability” is not an independent, siloed metric. It is a dependent variable, a function of core business operations.
The Variables Map to the Model: The variables in this function (LCA RM, Opt Log Rm, OEE, LCA out) are exactly the data models shown in the Page 12 integration diagram.
The OEE Imperative: The most critical variable in this function is OEE (Overall Equipment Effectiveness). OEE is a classic, high-frequency manufacturing metric, a composite of Availability, Performance (part of Maintainability), and Quality. OEE can only be calculated accurately using real-time, high-fidelity data from “Shop Floor OT” systems (PLC, DCS).
The conclusion is inescapable: to “solve” for Sustainability, a company must solve for OEE, Logistics (Opt Log), and Lifecycle (LCA) in an integrated way.
A company that relies on “Manual or Software data ingestion” has no access to a real-time OEE variable. Therefore, it is mathematically impossible for that company to solve the sustainability function. They are forced to guess, estimate, and report in arrears.
The user’s hypothesis—that the future of ESG relies on integrated software, IT/OT integration, and real-time shopfloor data—is not just a theory. As proven by this equation, it is the only way to mathematically calculate and operationally manage sustainability.
Table 3: Analysis of the Integrated Sustainability Function (Page 12-13 Model)
This table explicitly connects the components of the Page 12 integration model to the variables of the Page 13 “Most Complex Function” and their underlying data sources.
| Component (Page 12 Diagram) | Function Variable (Page 13) | Data Source & Role |
|---|---|---|
| Factory Model on IndustryOS® | OEE | IndustryOS® IT/OT Integration (Real-time PLC/DCS data). Represents core operational efficiency and resource consumption. |
| RM Impact – LCA Models | LCA RM | IndustryOS® (Real-time material consumption data) + Supplier Data. Represents the "cradle-to-gate" impact. |
| APIs like SuperProcure™ | Opt Log Rm / Opt Log Out | External 3rd-Party API. Represents logistics, transportation, and Scope 3 data. |
| End of Life – LCA Models | LCA out | Data Models + Post-Consumer Data. Represents the "gate-to-grave" or "cradle-to-cradle" impact. |
| GroundESG® APIs | $$\text{out, Sustainability}$$ | The Central Integrating Application. This is the "solver" that continuously calculates the function's output. |
Strategic Implications: The Operationalization of Product Stewardship and AI-Driven Foresight
The construction of this sophisticated, integrated architecture is not merely a technical exercise. It is the fundamental enabler of the highest-level C-Suite strategic goals: “Product Stewardship” and true, AI-driven optimization.
Operationalizing "Product Stewardship"
The Sparrow documentation defines the ultimate ESG goal as “Product Stewardship”. This is defined as responsibility for a product’s “environmental, social, and governance impact across its entire lifecycle”. This lifecycle explicitly includes “Design,” “Produce,” “Sells,” “Using a product,” and “End-of-Life”.
This strategic goal of “Product Stewardship” is, in practice, an engineering and data integration problem. The “Current” ESG model of manual, siloed data makes stewardship impossible.
The integrated architecture detailed in Sections II, III, and IV is the only technical blueprint that can deliver on this strategic promise. There is a direct, one-to-one mapping:
- To Manage “Design” and “Produce”: A company needs the RM Impact – LCA Models and the Factory Model (OEE).1 This allows “Sustainable design choices” and “cleaner, efficient operations”.
- To Manage “Sells” and “Using a product”: A company needs integration with its supply chain and logistics, represented by the APIs like SuperProcure™.1 This enables “transparently, avoiding greenwashing and ensuring ethical sourcing claims”.
- To Manage “End-of-Life”: A company needs the End of Life – LCA Models in Real Time to enable “Product take-back and collection programs” and “Recycling and recovery operations”.
Therefore, the integration model on Page 12 is the technical blueprint for achieving the strategic goal on Page 5. The user’s hypothesis is validated as the prerequisite for Product Stewardship.
Beyond Reporting to Prediction and Optimization
The ultimate “Future” state is not just “true accounting” but “AI-based ESG optimization”.
The “true accounting” engine (Section III) creates a massive, high-fidelity, real-time dataset. This dataset is the food that advanced AI models require. A system built on “Manual or Software data ingestion” starves its AI, forcing it to work with stale, incomplete, and low-trust data. A system built on IT/OT integration provides a continuous feast.
Page 22 provides a powerful visualization of this AI-driven payoff. It shows a company’s “Actual Journey” of CO2 emissions deviating from its “Planned Journey.” An AI model, fed by the real-time, integrated data from IndustryOS®, can generate a “Predicted Journey (AI) with Solution.”
Crucially, this AI-generated solution is not a generic guess. It is composed of specific, data-driven projects identified from the platform, such as “Project-2: OEE Improvement”. The AI can identify this opportunity only because it is ingesting the real-time OEE variable from the Factory Model. It can correlate a dip in OEE (e.g., higher rework, more waste) with a spike in emissions and energy consumption, and then model the “Sustainability Target” impact of fixing that operational problem.
This is the ultimate payoff of the integrated architecture: AI-driven, predictive, and operational sustainability. The “Sparrow AI Labs” examples, which show correlations between “GHG Emission v/s Product 1” and automated benchmarking , are all applications that are only possible when built on this foundation of “true accounting” and real-time IT/OT data.

Conclusion: The Technical Validation of ESG's Future
This exhaustive analysis of the Sparrow industrial technology ecosystem, as detailed in its technical and strategic documentation , confirms the user’s hypothesis without reservation. The future of Environmental, Social, and Governance (ESG) is unequivocally tied to the deep integration of software, the convergence of Information Technology (IT) and Operational Technology (OT), and the continuous flow of real-time shopfloor data for “true accounting.”
The Sparrow ecosystem provides a definitive, end-to-end case study of this new architecture. The evidence is clear and interconnected:
- The Strategic Need: The “Current” state of manual, archival ESG reporting is operationally untenable, high-risk, and incapable of driving change. The “Future” vision is “IT-OT integration,” “Digital twin models,” and “AI-based ESG optimization”.1
- The Technical Foundation: The IndustryOS® platform, with its “iLOL” digital twin, provides the contextual engine to bridge “Shop Floor OT” (PLC/DCS) and “Top Floor IT” (SAP/Oracle). This creates a single, unified data stream, fusing operational and business data in real-time.
- The “True Accounting” Engine: This IT/OT integration is the prerequisite for the Auto-Accounting formula: Real Time Consumption Monitoring X GHG Emission Factor. This mechanism provides an automated, auditable, and continuous flow of emissions data “without any manual intervention.”
- The Integrated Application: This entire technical stack is synthesized in the “Most Complex Function” $f(\text{out, Sustainability}) = f(\text{LCA RM, Opt Log Rm, OEE, Opt Log Out, LCA out})$. The inclusion of the real-time, shopfloor metric OEE as a core variable in the sustainability equation is the final, mathematical proof. It demonstrates that sustainability is a function of operations and cannot be managed, optimized, or predicted without real-time, integrated data.
The Sparrow ecosystem provides a clear blueprint for the future. In this new paradigm, sustainability is not a report to be filed, but an operational variable to be managed. It is not a cost center for compliance, but a value driver for optimization. The user’s hypothesis is not just a possible future; it is the only future where ESG becomes a true, verifiable, and optimized function of the business, fully integrated from the shop floor to the top floor and across the entire value chain.
FAQ
The role of IT/OT integration (Information Technology/Operational Technology) is to act as the foundational data fabric that moves ESG from a static, compliance-driven function to a dynamic, real-time optimization engine.
Data Bridge: It is the critical convergence point that links high-level “Top Floor IT” systems (like SAP and Oracle, used for business planning) with granular “Shop Floor OT” (Operational Technology, such as PLCs, DCS, and SCADA systems on the factory floor).
Real-Time Data: It replaces manual data ingestion with a continuous, machine-driven flow, which is the prerequisite for “True Accounting” and moving from historical reporting to predictive sustainability analytics.
Operationalization: This integration is essential because sustainability is mathematically proven to be a function of core operational metrics, such as Overall Equipment Effectiveness (OEE). Without the real-time, high-fidelity data provided by IT/OT integration, it is impossible to calculate and actively manage the sustainability performance of an operation.
The IndustryOS® platform enables automated GHG (Greenhouse Gas) accounting by serving as the foundational industrial operating system that feeds a real-time data processing engine.
Real-Time Engine: It establishes a “True Accounting” process designed to function without any manual intervention.
Automation Formula: The automation is governed by the formula:
Real Time Consumption Monitoring X GHG Emission Factor = GHG Accounting & Reporting Scope – 1 & 2By integrating directly with shop-floor systems via IT/OT convergence, IndustryOS provides the Real Time Consumption Monitoring data (e.g., energy use, material consumption), allowing emissions to be calculated continuously, verifiably, and audibly back to the source.
The new architecture is a fundamental shift from compliance-driven, manual reporting to a technology-driven, real-time optimization engine. It is built on Integrated Software (GroundESG®), IT/OT Integration (IndustryOS®), and True Accounting (automated emissions).
IT/OT integration is the foundational data fabric that connects “Top Floor IT” with “Shop Floor OT” (PLC, SCADA). This convergence is necessary to provide the real-time operational data required to calculate and optimize sustainability as a function of metrics like OEE.
IndustryOS® automates GHG accounting through its real-time data processing engine, using the formula: Real Time Consumption Monitoring X GHG Emission Factor. This ensures a verifiable, continuous, and zero-manual intervention data flow.
It is the mathematical equation that proves sustainability is a dependent variable of core business operations, particularly OEE (Overall Equipment Effectiveness), logistics, and lifecycle assessments . It cannot be solved without integrated, real-time shopfloor data.
The architecture replaces manual, error-prone data entry with seamless IT/OT integration and auditable data sourced directly from production systems. This eliminates estimations and provides the necessary integrity for reliable, compliant reports.
The ultimate strategic goal is “Product Stewardship,” defined as managing a product’s full environmental, social, and governance impact across its entire lifecycle (from design and production to end-of-life) using integrated, real-time data models.
Deep Technology | Consulting | Solutions
Comments are closed.